
Columbia River Bridges
Background
The Interstate Bridge is actually a pair of nearly identical steel vertical lift, through-truss bridges that carry Interstate 5 traffic over the Columbia River between Vancouver, Washington, and Portland, Oregon. The northbound span was opened in 1917 for two-way traffic, and the southbound span was added in 1958, and now carries three lanes in both directions. More history and photos...
The Glenn L. Jackson Memorial Bridge, or I-205 bridge, is a segmental bridge that spans the Columbia River between eastern Vancouver, Washington and Portland, Oregon. It is a twin structure with four lanes in each direction and a 9-ft wide bicycle and pedestrian path in between, which opened for traffic in December 1982. More history and photos...
Columbia River Bridge Crossings, since 1961
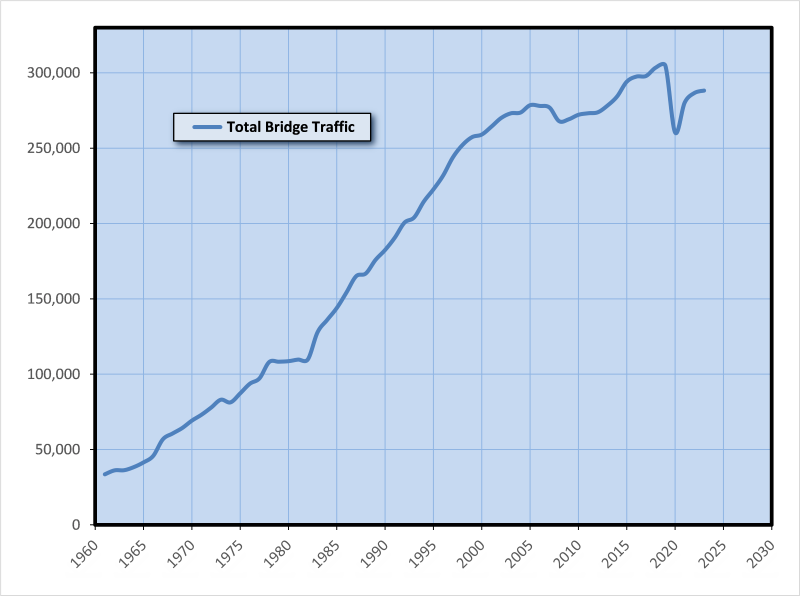
Historical average month and average weekday traffic data volumes, across the Interstate Bridge (I-5) and the Glenn Jackson Bridge (I-205), collected over the period 1961 through present. Actual data is shown below graph.
Crossing Data, 1961–2023
A good indicator of change in bi-state travel is the number of vehicle crossings over the Columbia River bridges between Washington and Oregon. Daily bridge traffic volumes have been recorded on the Columbia River bridges since 1961. The Interstate Bridge (I-5) carried approximately 33,500 vehicles a day in 1961. Volumes had increased to over 108,000 vehicles a day by 1980. With the opening of the Glenn Jackson Bridge (I-205) in late-1982, total Columbia River crossings had increased to 144,000 vehicles a day by 1985. By 1995, total river crossings had more than doubled compared to 1980 with 222,700 crossings. Glenn Jackson Bridge traffic volumes began to exceed Interstate Bridge traffic volumes on a daily basis in 1999. Total bridge crossings have declined three times since 1961, in 1974 (oil embargo), 2006-2008 (recession), and 2020 (COVID-19 Pandemic). Prior to the COVID-19 Pandemic total Columbia River crossings exceeded 300,000 vehicles a day. As of 2023, total crossings have yet to return to pre-pandemic levels.
Both Columbia River bridges are suffering daily congestion during morning and evening peak periods. The Interstate Bridge had reached capacity during peak hours in the early-1990s, and the Glenn Jackson Bridge in the mid-2000s. With both Columbia River bridges reaching capacity in the morning and evening peak periods, peak spreading has occurred. Peak spreading leads to a flattening and longer peak period as trips shift to times immediately before and after the peak demand. The impact of this type of congestion means that the peak hour becomes a peak period that can last three or more hours. The ongoing growth in all-day bridge crossings is now occurring during non-peak periods.
Average Weekday Crossings
| Year | I-5 | I-205 | Total | Annual Change | ||
|---|---|---|---|---|---|---|
| 1961 | 33,537 | 33,537 | NA | |||
| 1962 | 36,156 | 36,156 | 7.8% | |||
| 1963 | 36,263 | 36,263 | 0.3% | |||
| 1964 | 38,324 | 38,324 | 5.7% | |||
| 1965 | 41,446 | 41,446 | 8.1% | |||
| 1966 | 45,755 | 45,755 | 10.4% | |||
| 1967 | 56,757 | 56,757 | 24.0% | |||
| 1968 | 60,615 | 60,615 | 6.8% | |||
| 1969 | 64,248 | 64,248 | 6.0% | |||
| 1970 | 69,151 | 69,151 | 7.6% | |||
| 1971 | 73,089 | 73,089 | 5.7% | |||
| 1972 | 77,845 | 77,845 | 6.5% | |||
| 1973 | 83,038 | 83,038 | 6.7% | |||
| 1974 | 81,297 | 81,297 | -2.1% | |||
| 1975 | 87,255 | 87,255 | 7.3% | |||
| 1976 | 93,644 | 93,644 | 7.3% | |||
| 1977 | 97,247 | 97,247 | 3.8% | |||
| 1978 | 108,033 | 108,033 | 11.1% | |||
| 1979 | 108,273 | 108,273 | 0.2% | |||
| 1980 | 108,616 | 108,616 | 0.3% | |||
| 1981 | 109,676 | 109,676 | 1.0% | |||
| 1982 | 109,786 | 109,786 | 0.1% | |||
| 1983 | 89,331 | 38,412 | 127,743 | 16.4% | ||
| 1984 | 89,963 | 46,036 | 135,999 | 6.5% | ||
| 1985 | 91,367 | 52,600 | 143,967 | 5.9% | ||
| 1986 | 92,645 | 61,613 | 154,258 | 7.1% | ||
| 1987 | 96,685 | 68,325 | 165,010 | 7.0% | ||
| 1988 | 93,812 | 73,048 | 166,860 | 1.1% | ||
| 1989 | 92,999 | 82,812 | 175,811 | 5.4% | ||
| 1990 | 95,378 | 87,105 | 182,483 | 3.8% | ||
| 1991 | 101,190 | 89,437 | 190,627 | 4.5% | ||
| 1992 | 107,579 | 92,979 | 200,558 | 5.2% | ||
| 1993 | 110,288 | 93,748 | 204,036 | 1.7% | ||
| 1994 | 112,988 | 101,562 | 214,550 | 5.2% | ||
| 1995 | 116,589 | 106,103 | 222,692 | 3.8% | ||
| 1996 | 118,558 | 113,293 | 231,851 | 4.1% | ||
| 1997 | 120,644 | 123,165 | 243,809 | 5.2% | ||
| 1998 | 124,516 | 127,568 | 252,084 | 3.4% | ||
| 1999 | 126,589 | 130,761 | 257,350 | 2.1% | ||
| 2000 | 126,903 | 132,159 | 259,062 | 0.7% | ||
| 2001 | 125,652 | 138,664 | 264,316 | 2.0% | ||
| 2002 | 128,162 | 141,860 | 270,022 | 2.2% | ||
| 2003 | 129,657 | 142,300 | 271,957 | 1.2% | ||
| 2004 | 130,279 | 143,358 | 273,637 | 0.2% | ||
| 2005 | 132,603 | 145,927 | 278,530 | 1.8% | ||
| 2006 | 131,916 | 146,127 | 278,043 | -0.2% | ||
| 2007 | 130,389 | 146,606 | 276,995 | -0.4% | ||
| 2008 | 126,278 | 141,661 | 267,939 | -3.3% | ||
| 2009 | 125,436 | 143,742 | 269,178 | 0.5% | ||
| 2010 | 126,691 | * 145,457 | 272,148 | 1.1% | 1 | |
| 2011 | 128,115 | 145,054 | 273,169 | 0.4% | ||
| 2012 | 128,373 | 145,440 | 273,813 | 0.2% | ||
| 2013 | 130,511 | 148,152 | 278,663 | 1.6% | ||
| 2014 | 132,592 | 151,735 | 284,327 | 2.2% | ||
| 2015 | 135,696 | 158,409 | 294,105 | 3.4% | ||
| 2016 | 135,496 | 162,031 | 297,527 | 1.2% | ||
| 2017 | 135,000 | 162,932 | 297,932 | 0.1% | ||
| 2018 | * 138,374 | 165,097 | 303,471 | 1.9% | 2 | |
| 2019 | 138,530 | 166,152 | 304,682 | 0.4% | ||
| 2020 | 120,332 | 140,137 | * 260,469 | -14.5% | 3 | |
| 2021 | 130,715 | 149,611 | 280,326 | 7.6% | ||
| 2022 | 132,746 | 153,879 | 286,625 | 2.2% | ||
| 2023 | 133,737 | 154,492 | 288,229 | 0.6% | ||
|
1 Due to construction on the I-205 bridge, average weekday crossings were estimated in 2010. 2 Due to the I-5 paving project, average weekday crossings were estimated in 2018. 3 Due to the COVID-19 Pandemic, traffic decreased in March 2020. |
||||||
Source: ODOT
See Also
- Columbia River Bridge Crossings
- Average Hourly Traffic, I-5, 1983-2020
- Average Hourly Traffic, I-205, 1983-2020
- All-Time Record Crossing Volumes
