
2014 Congestion Monitoring Report Indicates Increased Bi-State Congestion
Introduction
Recent data confirms that the region’s traffic is exceeding pre-recession travel levels and the transportation system is showing signs of stress. While it may be impossible to totally remove all congestion, congestion needs to be managed in order to provide a reliable transportation system and support economic vitality.
RTC’s federally required Congestion Management Process (CMP) is a regional program that analyzes travel delay characteristics and provides system performance information on major streets and state highways. It is a tool to be used within the transportation decision-making process.
The information and data contained in the congestion management process is used to identify transportation needs and encourages cost-effective strategies that complement major capital needs. Within the annual transportation funding program, prioritization is given to projects which address deficiencies identified through the CMP.
The purpose of this summary is to provide a snapshot of the region’s most congested roadways and a quick look at some strategies to improve system performance.
Key Findings
Clark County’s population is growing and regional jobs are growing even faster. Clark County added 7,300 people and 14,400 jobs between 2010 and 2014, while the Portland region added 96,900 jobs during the same time period. Notably, the region had lost 70,000 jobs between 2008 and 2010. Clark County accounts for almost 12% of the region’s total employment. This increase in population and employment has resulted in additional trips, especially during peak commute periods.
The CMP shows that implementation of the 20-year Regional Transportation Plan (RTP) can largely address the corridor capacity needs over the next 20 years. The lack of transportation revenues and regional consensus is leading to deferred maintenance and infrastructure improvements. The deferral of these projects will result in higher future costs, and will make the implementation of the RTP more challenging.
In the near-term, the region will need to implement low cost system operation and management strategies where long-term improvements are delayed. There is an immediate need to implement additional low-cost strategies for the I-5 South Corridor to deal with bi-state travel congestion.
Bi-State Traffic Growth
The major hot spot for regional congestion includes bi-state travel between Clark County and Oregon. The demand for bi-state travel has increased each year, except for a three year period during the recent recession (2006-2008). The following table shows historic growth in Columbia River bridge crossings since 1980:

|

|
| Year | I-5 | I-205 | Total |
|---|---|---|---|
| 1980 | 108,600 | n/a | 108,600 |
| 1990 | 95,400 | 87,100 | 182,500 |
| 2000 | 126,900 | 132,100 | 259,000 |
| 2010 | 126,700 | 145,500 | 272,200 |
| 2014 | 132,600 | 152,700 | 284,300 |
Bi-State Bridge Delay
During the morning commute, drivers are experiencing a significant increase in delay on I-5 South, I-205 South, and SR-14 immediately east of I-205. Delay represents the additional travel time experienced due to congestion.
With both bridges experiencing congestion, peak spreading is occurring. Peak spreading leads to a flattening and longer peak period as trips shift to periods immediately before and after the peak demand. The impact of congestion means that fewer vehicles cross the bridges in the peak two hours, while more vehicles cross the bridges during the peak six hour period.
Transportation System Performance
Transportation system performance can be measured in several ways, especially when considering a multimodal transportation system. RTC’s congestion management process includes performance measures related to volume, capacity, speed, occupancy, safety, trucks, and transit. When viewed collectively, these performance measures provide a more comprehensive view of the transportation needs within the region. This summary report includes a snapshot of only a few of the performance measures included in the full congestion report.
Corridors: Volume to Capacity
The corridor capacity ratio is an aggregation of the volume/capacity ratios for the individual segments that make up a corridor. The capacity ratio provides an indication of how well the transportation facility carries the existing traffic volumes. The closer the ratio is to one, the worse the traffic congestion. A ratio above 0.90 is an indicator of significant congestion.
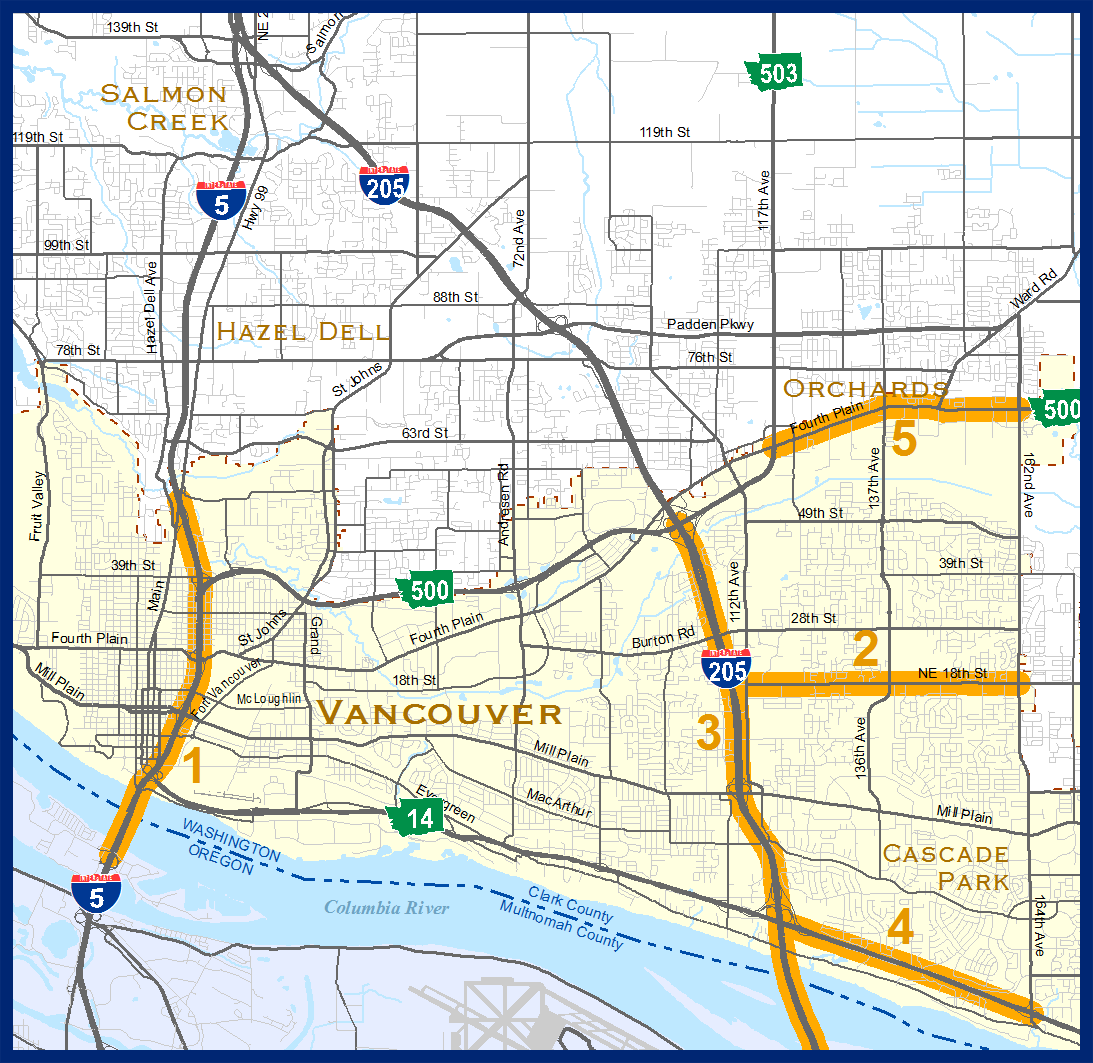
The five worst volume to capacity corridors are:
| 1 | I-5, Main St. to Jantzen Beach (AM) | >1.00 |
| 2 | 18th St., 112th Ave. to 162nd Ave. (PM) | 1.00 |
| 3 | I-205, Padden Parkway to Airport Way (AM) | 0.90 |
| 4 | SR-14, 164th Ave. to I-205 (AM) | 0.90 |
| 5 | Fourth Plain, 117th Ave. to 162nd Ave. (PM) | 0.90 |
|
At the I-5 Bridge, traffic demand exceeds available capacity during the morning commute. The result is that fewer vehicles are able to get through the corridor. |
||

Corridors: Lowest Speed Percentage
The level of speed in the corridor is ranked by comparing actual measured travel speed to the posted speed limit. The percentage along arterials is often directly connected to delay at signalized intersections. Improved progression and coordination between signals will improve overall travel time and safety. A travel speed lower than 60% of the posted speed limit is below average and is an indicator of delay.
The eight lowest speed percentage corridors are:
| 1 | I-5, Main St. to Jantzen Beach (AM) | 22% |
| 2 | SR-14, 164th Ave. to I-205 (AM) | 43% |
| 3 | Main St., Ross St. to Mill Plain (AM) | 48% |
| 4 | Fourth Plain, 117th Ave. to 162nd Ave. (PM) | 49% |
| 5 | 164th Ave., SR-14 to Mill Plain (PM) | 51% |
| 6 | Mill Plain, I-205 to 192nd Ave. (PM) | 54% |
| 7 | SR-500, I-5 to Andresen Rd. (PM) | 54% |
| 8 | Highway 99, Ross St. to 139th St. (PM) | 56% |

Corridors: Transit Ridership
C-TRAN uses an automated ridership collection system on their vehicles to collect ridership data. Transit ridership represents the number of passengers in the evening peak direction at a specific location within each corridor. Transit ridership is often reflective of access to transit including frequency of service and bus capacity. Transit ridership in a corridor increases the person carrying capacity of a corridor.
The five highest transit ridership corridors are:
| 1 | I-5, Jantzen Beach to Main St. (PM) | 1532 |
| 2 | Fourth Plain, I-5 to Andresen (PM) | 598 |
| 3 | I-5, Main St. to I-205 (PM) | 578 |
| 4 | I-205, SR-500 to Airport Way (AM) | 544 |
| 5 | SR-14, 164th Ave. to I-205 (AM) | 539 |
Key Regional Strategies
The information and data contained in the CMP Report is used to identify appropriate congestion management strategies for the region. The following strategies have been identified through the RTP:
- Transportation System Management and Operations (TSMO) strategies must be a part of cost-effectively managing each corridor.
- Capacity should be selectively added where other strategies have been exhausted.
- The region must continue to work towards a long-term solution for bi-state travel needs. In the near-term, the region will need to implement additional Transportation System Management and Transportation Demand Management options to maximize the existing capacity.
Local Strategies
Because each roadway corridor has its own characteristics, congestion management efforts must be tailored to meet the needs of an individual roadway. Local agencies must employ a variety of strategies to effectively manage congestion. The CMP Toolbox, contained in the CMP Report, is a reference tool for the development of local strategies.
Congestion Monitoring Report
The Congestion Management Process Monitoring Report includes a warehouse of transportation data and an analysis of transportation system performance. The data is translated into tables and maps that are contained in the full report. The full CMP report, including transit and other multimodal data, is available on RTC’s website.
For More Information
You can get more information on the Congestion Management Process by contacting RTC at 360-397-6067 or by visiting the project website at http://www.rtc.wa.gov/programs/cmp.
